

Original Research: Poverty and Social Polarization: DC, Baltimore, and Atlanta
Census Tract Level Poverty Model Using Demographic Data and Spatial Social Polarization: A Study of Washington, DC, Baltimore, MD, and Atlanta, GA
Author: Christopher Williams, Founding Director, Public Health Liberation, cwilli30@umd.edu
Highlights
Index of Concentration at the Extremes (ICE) is a measure of spatial social polarization that has been shown to be useful for public health
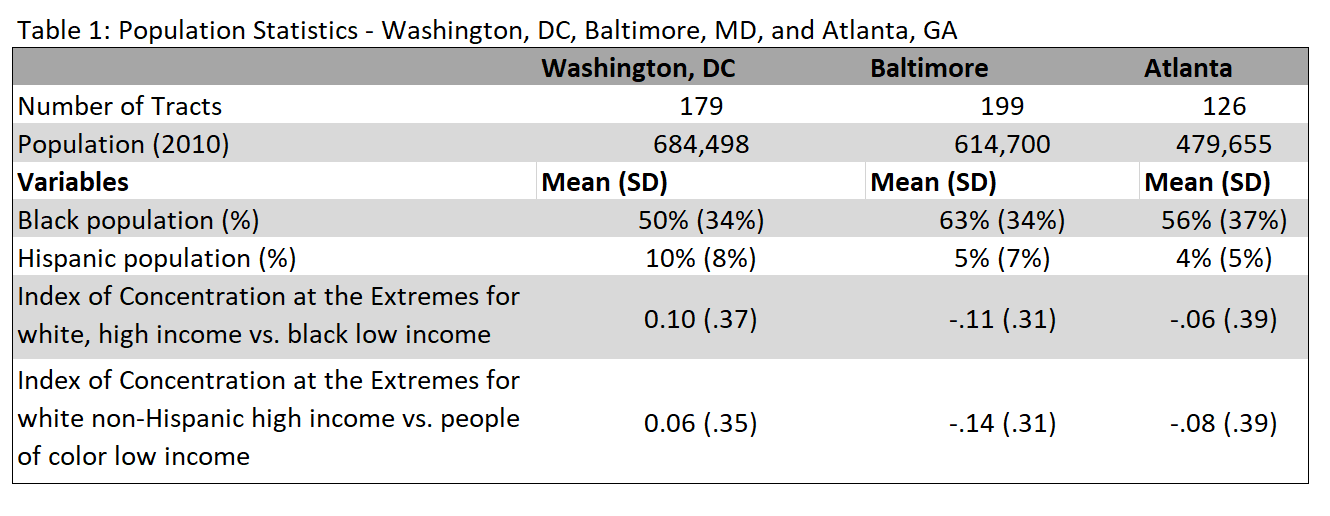
Washington, DC, Baltimore, MD, and Atlanta, GA are cities in the US South that have similar sized populations and percentages of Black populations
Two measures of race/ethnicity and one measure of index of social polarization predicted percentage of poverty. Race and ICE were consistently significant variables in all final models in the three cities.
Background
Index of Concentration at the Extremes (ICE) is a measure of spatial social polarization that has been shown to be useful for public health.1,2 First proposed in the sociological literature by Douglas Massey3, ICE quantifies bimodal extremes within geographic areas such as zip codes or census tracts (CT). It typically involves income (e.g. 20th v. 80th percentile), race (e.g. Black v White), or a combination of the two (e.g. high-income of one group v. low-income of another group). The formula is expressed as follows: ICEi=(Ai–Pi)/Ti.
The Public Health Disparities Geocoding Project (PHDGP) at the Harvard T. H. Chan School of Public Health has made available ICE data for all US census tracts using white, high income vs. black low income (ICE-1) and white non-Hispanic high income vs. people of color low income (ICE-2).4 They computed ICE measures using data from the US Census American Community Survey (2014-2018). Their efforts were motivated by the need to address health inequities in the shadow of the COVID-19 pandemic.

Plotting of Index of Concentration at the Extremes by zip code
Methods
Using PHDGP data, this study examined CT level percentages of African American/Black race and Hispanic ethnicity, ICE-1, and ICE-2 for all census tracts in Washington, DC, Baltimore, MD, and Atlanta, GA. CT percentage of poverty was the outcome variable for five regression models. The first model was a simple linear regression for CT percentage of Blacks (predictor) and CT poverty (outcome) in each city. Multivariate linear regression was used to assess the goodness of fit for poverty (%) and four predictor variables in Washington, DC for model 2. Homogeneity of variance assumption is tested with a histogram of the residuals. Pearson correlation indicated strength of association and direction. ANOVA results determined significance of R correlation. Normal P-P plot of standardized residual was generated to test normality of residuals.
Model 3 initially included four mean-centered interaction terms to reduce multicollinearity. The model assessed model assumptions that multicollinearity is absent using variance inflation factors (VIF) less than 10. Multiple variance proportions above 0.9 for the same dimension and condition indexes above 15 are used to determine collinearity. A scatterplot with standardized residuals and standardized predicted values outside of -3 and 3 tested assumptions of independence and constant variance. Models 4 and 5 were used to model the relationship between CT poverty percentage and predictor variables in Baltimore, MD and Atlanta, GA. Census tracts were excluded in analysis due to a population size less than 60. An alpha level of 0.05 was used to determine statistical significance. US Census tracts were extracted from Policy Map database.5 Analysis was conducted using IBM SPSS Statistics, Version 26 (IBM Corp., Armonk, NY).
Results
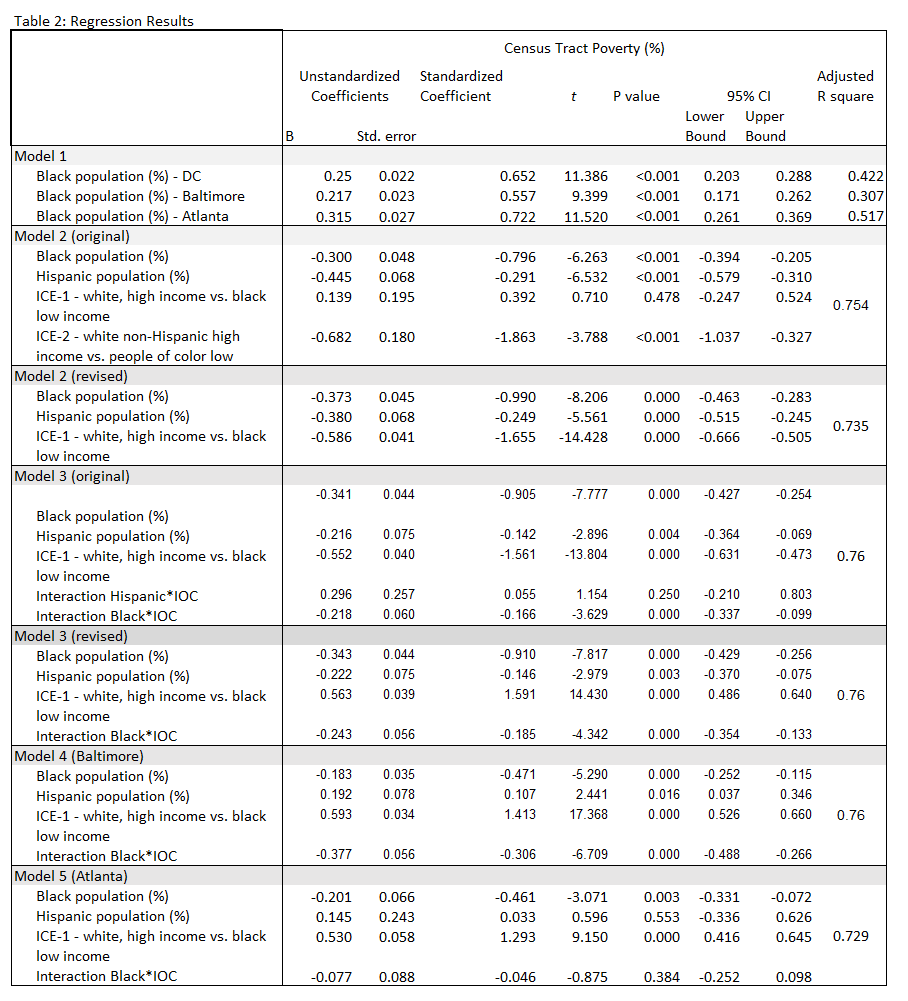
Washington, DC, Baltimore, MD, and Atlanta, GA are cities in the US South that have similar sized populations and percentages of Black populations (34%-37%) (Table 1). Black percentage was bimodally distributed in Washington, DC and Atlanta, GA, while left-skewed in Baltimore (not shown). Hispanic percentages were right-skewed in all cities. Regression normality assumption applies to the residuals, meaning this did not preclude regression analysis. In addition to two CTs with low populations, there were outliers removed in DC (n=2), Baltimore (n=4), and Atlanta (n=2) based on multivariate significance testing for probability of the Mahalanobis distance. Model 1 showed that CT poverty percentage explained between 30.7% - 51.7% of the variance (Table 2).
Preliminary ANOVA results were significant for model 2 (F(4, 172) = 135.908, p<0.001) (Table 2). Predictor variables explained 75.4% of the variance in percentage of poverty for model 2. All predictor variables were significant (p<0.001) except ICO-1 (p=0.478). However, IOC 1 and IOC 2 had unacceptable VIFs, respectively 217.8 and 173.1. IOC-2 was removed and the model was rerun and generated acceptable VIFs. ANOVA was significant in the revised model, (F(3, 173) = 163.789, p<0.001). The adjusted R square was 0.735 (Table 2). Standardized betas for percentage of Blacks (-0.999), Hispanics (-0.249), and IOC-1 (-1.655) were significant (p<0.001).
Since model 2 indicated multicollinearity based on VIFs, IOC-2 was excluded from model 3 and a mean-centered IOC-1 was used. This eliminated the need for two interaction terms involving IOC-2. The interaction terms for mean-centered Black percentage and IOC-1 and Hispanic percentage and IOC-1 were retained. VIFs were within an acceptable range. Assumptions of constant variance and independence were met. Model 3 was significant based on ANOVA (F(5, 171) = 112.67, p<0.001). The adjusted R square was 0.76. Percentage of Blacks (B=-0.905), Hispanics (B=-0.142), and interaction between mean-centered Black percentage and IOC-1 (-0.166) showed an inverse relationship to poverty percentage at the census tract level while mean-centered interaction of Hispanic percentage and IOC-1, respectively, showed a positive relationship (p=1.561, p=0.055)(Table 2). Black percentage (p=0.018), Hispanic percentage (p=0.004), mean-centered IOC-1 (p<0.001), and Black/IOC-1 interaction (p<0.01) were significant. Interaction of Hispanic and ICE-1 was dropped and the model was rerun. None of the dimensions in the revised model 3 exceeded a condition index of 15. Two variance proportions above .9 but not sufficient to change the model since no other pair was found. Assumptions of independence and constant variance were met. Standardized residuals showed goodness of fit based on normal distribution with normal P-P plot and histogram (not shown).
The modified Model 3, excluding IOC-2 and related interaction terms, was repeated for census tracts in Baltimore, MD and Atlanta, GA to create models 4 and 5, respectively. Baltimore had 198 census tracts while Atlanta had 124. ANOVA results were significant, respectively for Baltimore and Atlanta: (F(4, 193) = 155.69, p<0.001) and (F(4, 119) = 83.8, p<0.001) (Table 1). Both cities had similar adjusted R square values to Washington DC (0.76 v. 0.729 and 0.76). The VIFs, condition indexes, variance proportions, and plotted standardized residuals were within acceptable range for Baltimore. VIP for Black percentage was slight above 10 (10.3) for Atlanta. As well, the scatterplot of standardized residuals did not appear to be randomly plotted.
Discussion
Although Black CT percentage alone explained a major share of the variance for CT poverty percentage, ICE improved the R square. The use of ICE-2 was redundant with ICE-1 based on modeling and was likely less relevant to this study because Blacks constituted a majority in two of the three cities. In DC, it was just under a majority at 50%. The model indicated goodness of fit using regression. Multicollinearity was reduced by removing variables in a stepwise fashion. The non-normality of the data may have posed issues with normality of the residuals, especially for Atlanta. Future studies can refine the model with data transformation.
This study achieves significant adjusted R square values with two measures of race/ethnicity and one measure of spatial social polarization to predict CT poverty. Consistent across studies is that a smaller percentage of Blacks in a CT and higher social polarization between White high earners and Black low earners is a risk factor for CT poverty. In cities that are primarily composed of Blacks and Whites, this modeling suggests that the conditions for poverty may rest with racial dispersion patterns and economic disparities. Although this model is less sophisticated than others in the field, that there is such a strength of association with CT percentage of Blacks alone and CT poverty raises important concerns about structural inequity.
Public Health Implications
This study showed that PHDGP’s aim to address health inequities with CT ICE measures is achievable. The conclusion from this study suggests that public health should continue to shift resources to affect upstream determinants of health and public policy.
References
1 Feldman, J. M., Waterman, P. D., Coull, B. A., & Krieger, N. (2015). Spatial social polarisation: using the Index of Concentration at the Extremes jointly for income and race/ethnicity to analyse risk of hypertension. Journal of epidemiology and community health, 69(12), 1199–1207. https://doi.org/10.1136/jech-2015-205728
2 Krieger, N., Kim, R., Feldman, J., & Waterman, P. D. (2018). Using the Index of Concentration at the Extremes at multiple geographical levels to monitor health inequities in an era of growing spatial social polarization: Massachusetts, USA (2010–14). International journal of epidemiology, 47(3), 788-819.
3 Massey DS. The prodigal paradigm returns: ecology comes back to sociology. In: Booth A, Crouter A (eds). Does It Take a Village? Community Effects on Children, Adolescents, and Families Mahwah, NJ: Lawrence Erlbaum Associates, 2001, pp. 41–48
4 Harvard T.H. Chan School of Public Health. (n.d.). Retrieved from https://www.hsph.harvard.edu/thegeocodingproject/
5 Poverty Percentage at Census Tract Level for Washington, DC, Baltimore, MD, and Atlanta, GA. PolicyMap. http://www.policymap.com/our-data-directory.html#Census:%20Decennial%20Census%20and%20American%20Community%20Survey%20 (ACS). (31 May 2020).